
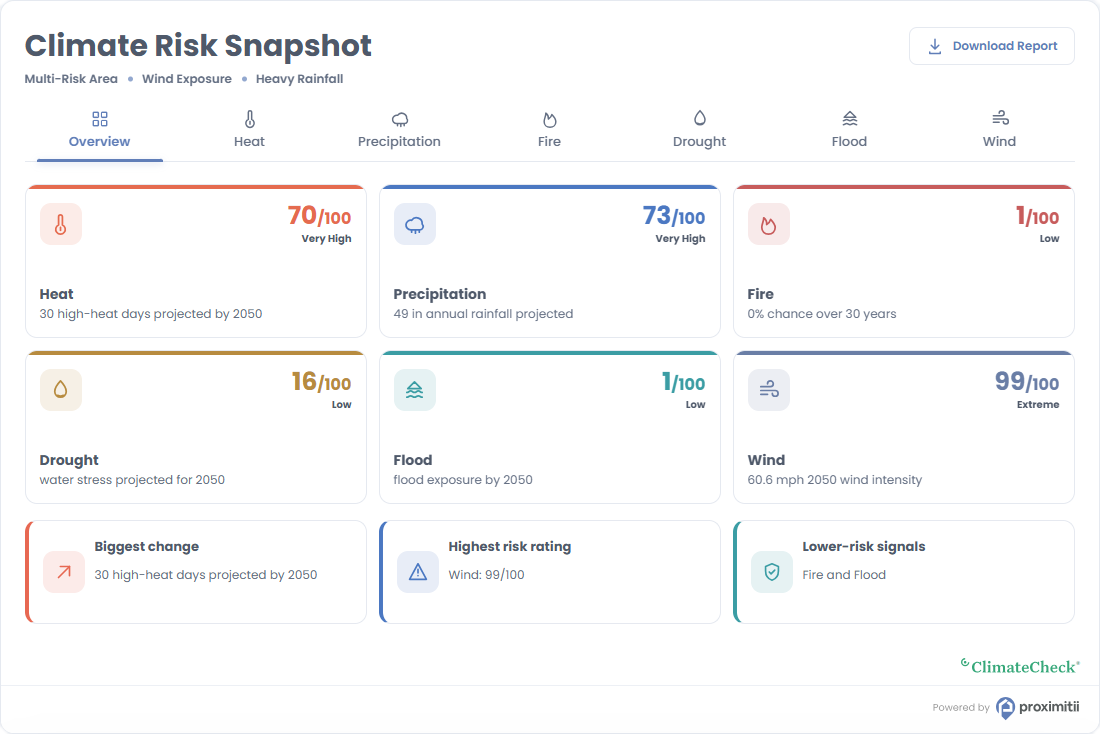
The Climate Widget shows location-based climate risk categories and highlights for an address in the United States or Canada. Visitors can also open a Local Insights report when the Download Report button is enabled.
Installation
Add the container and widget script to your page. Replace the widget key and coordinates with your own values.
<div id="prox-climate"></div>

<script src="https://widget.proximitii.com/v1/core/proximitii-widget.js?v=41"></script>
<script>
ProximitiiWidgets.climate({
  container: 'prox-climate',
  widgetKey: 'PUT_YOUR_WIDGET_KEY_HERE',
  lat: 40.778832684988224,
  lon: -73.98103168840414
});
</script>
Always provide a valid widgetKey, lat, and lon. All other settings are optional and use the defaults below.
Customization
Pass optional settings in the ProximitiiWidgets.climate configuration object. The Download Report mode is set on the container element.
| Option | Purpose | Default | Accepted values | Setting |
|---|---|---|---|---|
| Container | ID of the element where the widget renders. | N/A | Valid element ID | container |
| Widget Key | Your public widget key. | N/A | Valid widget key | widgetKey |
| Latitude | Center latitude. | N/A | -90 to 90 | lat |
| Longitude | Center longitude. | N/A | -180 to 180 | lon |
| Radius | Search radius in metres. | 500 | 100 to 6,400 | radius |
| Country | Climate dataset. | us | us or ca | country |
| Language | Widget language. | en | en or fr-CA | language |
| Title | Heading above the climate snapshot. | Climate Risk Snapshot | Text | title |
| Title Font Size | Heading size. | 30px | CSS size | titleFontSize |
| Show Highlights | Show or hide local climate highlights. | true | true or false | showHighlights |
| Show Download Report | Show or hide the report control. | true | true or false | showDownloadReport |
| Download Report Mode | Choose referral, lead capture or no button. | referral | referral, lead, hidden | data-download-report on the container |
| Show Border | Show or hide the widget border. | true | true or false | showBorder |
| Primary Color | Primary brand color. | #607eb8 | Hex color | primaryColor |
| Secondary Color | Secondary panel color. | #f6f8fb | Hex color | secondaryColor |
| Font Family | Widget font. | Poppins, sans-serif | CSS font family | fontFamily |
| Box Style | Widget container styling. | shadow | shadow or flat | boxStyle |
| Categories | Risk categories to display, in order. | All available categories | Array of category slugs below | categories |
For a lead-capture report button, add data-download-report="lead" to the container. Use hidden to remove the button. The default referral mode needs no attribute.
<div id="prox-climate" data-download-report="lead"></div>

<script>
ProximitiiWidgets.climate({
  container: 'prox-climate',
  widgetKey: 'PUT_YOUR_WIDGET_KEY_HERE',
  lat: 40.778832684988224,
  lon: -73.98103168840414,
  radius: 800,
  country: 'us',
  primaryColor: '#2e6653',
  boxStyle: 'flat'
});
</script>
Categories
Use categories to control which climate risk categories appear. Select at least one category. Wind is available for US locations and is omitted for Canada.
| Category | Value |
|---|---|
| Heat | heat |
| Precipitation | precipitation |
| Fire | fire |
| Drought | drought |
| Flood | flood |
| Wind (US only) | wind |