








Corpus Christi Photo

Bay Area, Corpus Christi,TX

Neighborhood Data
Proximitii Score score
? /100
Amenities Score Amenities Score Locked
Transit Score Transit & Commute Score Locked
Schools Score Schools Score Locked
Health & Safety Score Health & Safety Score Locked
City Crime Score Crime (City) Score Locked
Location Crime Score Crime (Location) Score Locked
Economy Score Economy Score Locked
Housing Score Housing Score Locked

If you’re considering a move to Corpus Christi, TX, the Bay Area neighborhood in the southeast part of the city offers a wonderful blend of coastal charm and suburban comfort. This area is popular among families and professionals alike, thanks to its welcoming community vibe and access to plenty of outdoor activities. Residents enjoy easy access to beautiful parks like the popular Bayfront Park, which is perfect for picnics, jogging, or just soaking in the scenic views of the water. For those who love water sports or fishing, the nearby Corpus Christi Bay provides ample opportunities to get out on the water and enjoy the sunny Texas weather.

One of the standout features of the Bay Area neighborhood is its proximity to major attractions like the Texas State Aquarium and the USS Lexington Museum. These spots are not only fantastic places for family outings but also serve as great educational experiences for kids and adults alike. Shopping and dining options are plentiful, with several local boutiques, seafood restaurants, and cafes that give the area a distinct coastal flair. The community also hosts various events throughout the year, fostering a strong neighborhood spirit and plenty of chances to meet fellow residents.

Getting to Downtown Corpus Christi from the Bay Area is very convenient, with just a short 10 to 15-minute drive depending on traffic. This makes it easy for residents to enjoy the excitement and amenities of the city’s core while coming home to a quieter, more relaxed environment. Whether you’re commuting for work or planning weekend outings, the Bay Area provides a great balance between accessibility and tranquility. Overall, this neighborhood is a fantastic choice if you’re looking for a coastal lifestyle with all the conveniences of city living close at hand.

Bay Area Demographics

Population 41,838
Density (People/sqml.) 3,492
Median Age 38.5
Married Couples
45%
45% of the population of Bay Area aged 16 years and older are married.
Have Kids
25%
25% of the population aged 16 years or older have children.

25% of the Bay Area population aged 16 and up are married, which is in line with national averages. This balance suggests a neighborhood with a healthy mix of families, couples, and single residents, creating a well-rounded community dynamic. You are likely to find a blend of stability and social variety, appealing to both long-term homeowners and younger professionals alike.

With only 25% of people over 16 having children, you can expect an easygoing environment that tends to attract residents seeking a quieter lifestyle. The atmosphere here leans more toward adult-oriented living. Without the constant rhythm of school schedules or kid-centered events, the community maintains a slower, more relaxed pace. This makes it especially appealing to singles, couples, and empty nesters who appreciate tranquil streets, and recreation on their own terms.

Age Breakdown

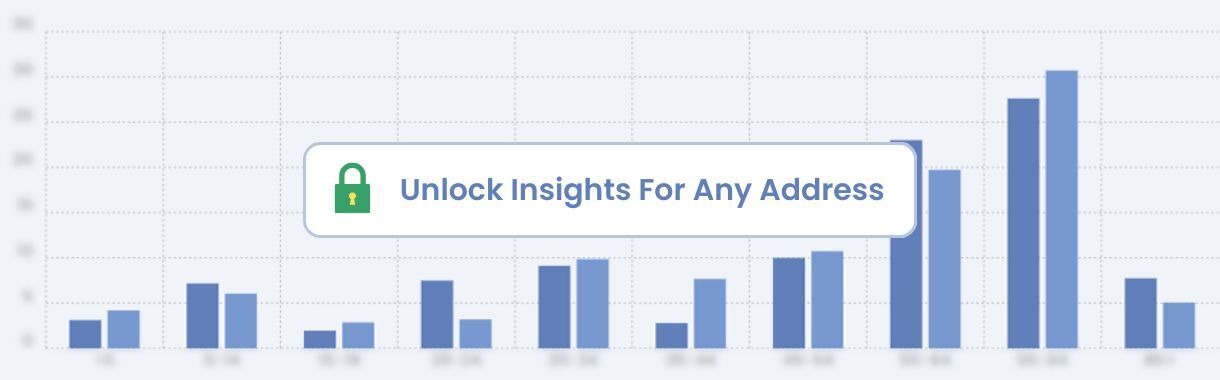
Bay Area neighborhood age breakdown chart

Exploring Bay Area demographics can reveal a lot about its character, pace, and overall lifestyle. Bay Area has a population of 41,838, which is larger than many other Corpus Christi neighborhoods, creating a lively and dynamic atmosphere. Its size brings an abundance of amenities, entertainment options, and community activities, while still offering spaces to unwind and enjoy the neighborhood’s unique character.

Bay Area has a population density of 3,492, which strikes a balanced feel when compared to other Corpus Christi neighborhoods. The area offers just the right mix of activity and breathing room, creating a community that’s lively yet comfortable, with easy access to amenities and everyday conveniences.

With an average age of 38, you're likely to find a well-balanced community where multiple generations live side by side. This mix of age groups contributes to a neighborhood atmosphere that’s both active and welcoming, offering a blend of fresh perspectives and long-standing community values.

Crime in Bay Area

Crime Safety Index Score Locked 1 2 3 4 5


Total Crime Incidents
Try for free within 1 mile
Score Locked per 100k people

Types of Crime

Bay Area neighborhood crime breakdown chart

Bay Area Crime Map

The Bay Area crime map provides an in-depth look at crime rates throughout the community, using block group data to reveal both safer pockets and places with more frequent incidents. By visualizing these patterns, the crime map helps residents and newcomers alike better understand the dynamics of neighborhood safety. It’s worth noting that higher-crime areas on the map aren’t always indicative of danger — spots near busy commercial centers, transportation hubs, or popular attractions may naturally show more reports due to increased activity.

Housing

? /10
Home Price $213,520
Median Rent $1,274
People/Household 2.6

Home Price Breakdown

Bay Area neighborhood home price breakdown chart

Rent vs Own

Rent 45% Own 55%

Year Moved In

Before 2010 60% After 2010 40%

Types of Homes in the Area

Market Trends

Year-over-Year Home Prices YoY data


Housing prices can reveal a lot about the balance and overall appeal of a neighborhood. In Bay Area, the median home price is about $213,520, which is on par with many comparable areas. This average pricing reflects a stable, affordable housing market and makes the neighborhood an appealing choice for a wide range of buyers seeking both value and long-term potential. Examining how home prices and appreciation rates in Bay Area have shifted over time can reveal important clues about the neighborhood’s future value. These trends help potential buyers and investors understand market momentum and determine whether the area is likely to deliver strong returns over the long term.

The median rent is around $1,274, which is on par with many comparable neighborhoods. This balanced pricing offers a mix of affordability and value, making it a practical choice for a wide range of renters.

Walkability & Lifestyle

Coffee Shops

Coffee Waves
Coffee Shop
min.
min.
Corner Bakery
Coffee Shop
min.
min.

Entertainment

Gorilla Zoe Jungle Club
Nightclub
min.
min.
Century 16 and IMAX
Cinema
min.
min.

Food & Drink

McDonald's
Fast Food
min.
min.
Torch Restaurant
Restaurant
min.
min.

Groceries

Gates Donut Shop
Bakery
min.
min.
H-E-B
Grocery Store
min.
min.

Parks

Brookdale Park
Park
min.
min.
Windsor Park
Park
min.
min.

Shops

Airline Barbershop
Hairdresser
min.
min.
Macy's
Department Store
min.
min.

Getting Around

Transit Stops

Airline @ Monette
Bus Stop
min.
min.
Airline @ Camden I
Bus Stop
min.
min.

Transit Stations


Health & Safety

Medical Facilities

CVS Pharmacy
Pharmacy
min.
min.
H-E-B Pharmacy
Pharmacy
min.
min.

Health Care

Tide Dental and Orthodontics
Dentist
min.
min.
Aspen Dental
Dentist
min.
min.

Safety

Corpus Christi Fire Department Station 11
Fire Station
min.
min.
Corpus Christi Fire Department Station 7
Fire Station
min.
min.

Top Rated Schools

Name Category Grades Rating
Meadowbrook El
901 Meadowbrook, Corpus Christi, TX
Elementary School PK - 5 School Score
King H S
5225 Gollihar Rd, Corpus Christi, TX
High School 9 - 12 School Score
Cesar E Chavez Academy
4613 S Padre Island Dr, Corpus Christi, TX
High School 9 - 12 School Score
Ray H S
1002 Texan Trl, Corpus Christi, TX
High School 9 - 12 School Score
Bokenkamp
5517 S Alameda, Corpus Christi, TX
Elementary School KG - 8 School Score
Cullen Middle
5225 Greely, Corpus Christi, TX
Elementary School 6 - 8 School Score
St Pius X Catholic School
737 Saint Pius Dr, Corpus Christi, TX
Elementary School PK - 6 School Score

Education Level Achieved

School ratings in Bay Area combine factors like student performance, graduation rates, and standardized test scores to provide a clear picture of overall educational quality. The use of NAEP (National Assessment of Educational Progress) scores adds valuable context by offering a consistent national benchmark to see how local schools compare on a broader scale. Additionally, understanding the overall education level achieved by residents in Bay Area can give insight into the community’s priorities and opportunities, helping families make more informed decisions about where to live and how well local schools may support long-term student success.