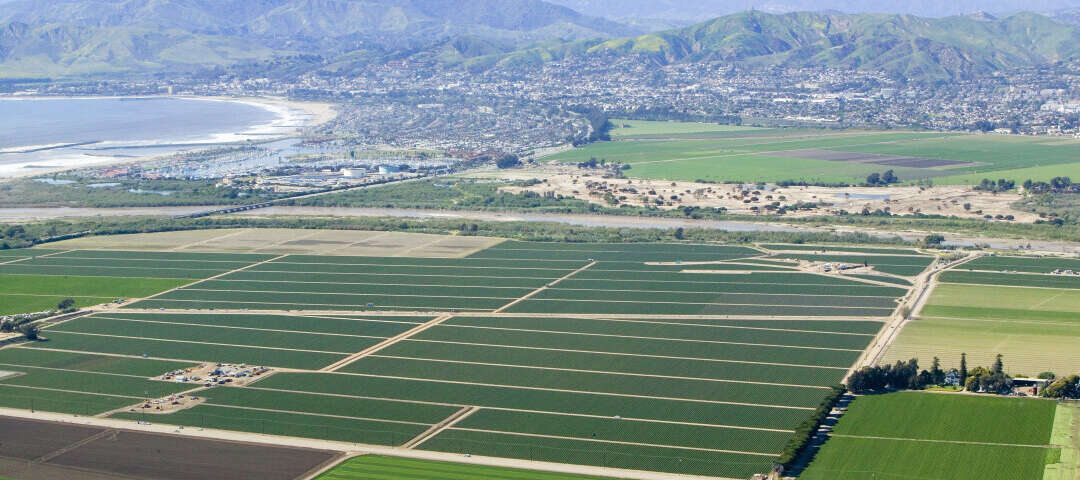
Oxnard Photo

Rio Lindo, Oxnard,CA

Neighborhood Data
Proximitii Score score
? /100
Amenities Score Amenities Score Locked
Transit Score Transit & Commute Score Locked
Schools Score Schools Score Locked
Health & Safety Score Health & Safety Score Locked
City Crime Score Crime (City) Score Locked
Location Crime Score Crime (Location) Score Locked
Economy Score Economy Score Locked
Housing Score Housing Score Locked

If you’re considering a move to Oxnard, CA, the Rio Lindo neighborhood in the southeast part of the city is definitely worth checking out. Known for its welcoming community vibe, Rio Lindo offers a blend of suburban calm and convenient city living. Residents enjoy easy access to parks like Rio Lindo Park, a local favorite spot for families and fitness enthusiasts alike, featuring walking trails, playgrounds, and picnic areas perfect for weekend gatherings. The neighborhood's tree-lined streets and well-maintained homes create a cozy atmosphere that makes settling in feel natural and comfortable.

One of the standout features of Rio Lindo is its proximity to some great local amenities without sacrificing quiet neighborhood charm. You’ll find plenty of options for dining, shopping, and entertainment just a short drive away. The nearby Collection at RiverPark is a popular shopping center offering everything from major retailers to cozy cafes, ensuring you have plenty of places to explore. For those who enjoy outdoor activities, the nearby Oxnard Beach Park provides a beautiful oceanfront escape, perfect for weekend picnics, beach volleyball, or simply relaxing by the water.

For commuters or anyone eager to explore the heart of the city, Rio Lindo is conveniently located about 5 miles southeast of Downtown Oxnard. This means you can enjoy the peacefulness of the neighborhood while still having quick access to the vibrant downtown area, where farmers markets, cultural events, and a variety of restaurants await. With its combination of community spirit, local attractions, and accessibility, Rio Lindo is an excellent choice for anyone looking to make Oxnard their new home.
Community Snapshot

Population 3,097
Density (People/sqml.) 2,882
Median Age 32.7
Married Couples
52%
52% of the population of Rio Lindo aged 16 years and older are married.
Have Kids
45%
45% of the population aged 16 years or older have children.

In Rio Lindo, 45% of residents aged 16 and older are married, which is notably higher than the national average. This could point to a more settled, community-driven neighborhood where long-term residents and homeowners are common. It’s the kind of place where stability, and a close-knit atmosphere make it especially appealing to families and couples looking to put down roots.

45% of people over 16 have children, so you're likely to find a balanced mix of family life and adult-oriented living. The neighborhood tends to feel lively without being overwhelming, with a good blend of young families, professionals, and long-term residents. Parks, playgrounds, and local schools contribute to a friendly community atmosphere, while quieter pockets and mature spaces appeal to those seeking peace and privacy. This balance makes the area welcoming to nearly everyone.

Age Breakdown

Rio Lindo neighborhood age breakdown chart

Rio Lindo demographics offer valuable insights into the character and lifestyle of the neighborhood, helping you understand who lives there and what daily life might feel like. Home to only about 3,097 residents, Rio Lindo is notably smaller than many other Oxnard neighborhoods, creating a more peaceful and community-oriented atmosphere. Its lower population can translate to quieter streets, a more relaxed pace of life, and easier access to local amenities — all without sacrificing the vibrant urban lifestyle the city is known for.

Rio Lindo has a population density of 2,882, which strikes a balanced feel when compared to other Oxnard neighborhoods. The area offers just the right mix of activity and breathing room, creating a community that’s lively yet comfortable, with easy access to amenities and everyday conveniences.

With an average age of 33, you're likely to find a well-balanced community where multiple generations live side by side. This mix of age groups contributes to a neighborhood atmosphere that’s both active and welcoming, offering a blend of fresh perspectives and long-standing community values.

Crime in Rio Lindo

Crime Safety Index Score Locked 1 2 3 4 5


Total Crime Incidents
Try for free within 1 mile
Score Locked per 100k people

Types of Crime

Rio Lindo neighborhood age breakdown chart

Rio Lindo Crime Map

The Rio Lindo crime map provides an in-depth look at crime rates throughout the community, using block group data to reveal both safer pockets and places with more frequent incidents. By visualizing these patterns, the crime map helps residents and newcomers alike better understand the dynamics of neighborhood safety. It’s worth noting that higher-crime areas on the map aren’t always indicative of danger — spots near busy commercial centers, transportation hubs, or popular attractions may naturally show more reports due to increased activity.

Housing

? /10
Home Price $608,750
Median Rent $2,235
People/Household 4.0

Home Price Breakdown

Rio Lindo neighborhood home price breakdown chart

Rent vs Own

Rent 39% Own 61%

Year Moved In

Before 2010 69% After 2010 31%

Types of Homes in the Area

Market Trends

Year-over-Year YoY data


Housing costs often reflect the desirability and overall character of a neighborhood. In Rio Lindo, home prices come in around $608,750, which is higher than many other areas. This elevated pricing points to a sought-after location with strong demand, well-maintained properties, and access to premium amenities that contribute to a higher quality of life. Historical home price trends and appreciation rates in Rio Lindo can serve as a window into the neighborhood’s economic strength and future potential. By understanding how the market has performed in the past, buyers and investors can better evaluate whether the area offers promising opportunities for growth and long-term value.

With an average rent price of $2,235, rental rates in Rio Lindo are higher than many other neighborhoods. This reflects the area’s desirability and strong demand, often accompanied by well-maintained properties, premium amenities, and a high quality of life.

Walkability & Lifestyle

Coffee Shops

Coffee Been & Tea Leaf
Coffee Shop
min.
min.
Starbucks
Coffee Shop
min.
min.

Entertainment

Robert Q Valles Center for the Performing Arts
Theatre Arts
min.
min.
Attraction
Attraction
min.
min.

Food & Drink

Tacos Mi Pueblo
Fast Food
min.
min.
Rubio's
Fast Food
min.
min.

Groceries

Vons
Grocery Store
min.
min.
Walmart Supercenter
Grocery Store
min.
min.

Parks

Rio Lindo Park
Park
min.
min.
Playground
Playground
min.
min.

Shops

Ross
Department Store
min.
min.
Mobil
Convenience Store
min.
min.

Getting Around

Transit Stops

Alvardo & Ventura
Bus Stop
min.
min.
Alvardo & Ventura (Northbound)
Bus Stop
min.
min.

Transit Stations

Bus Station
Bus Station
min.
min.
Oxnard
Transit Station
min.
min.

Health & Safety

Medical Facilities

Walgreens
Pharmacy
min.
min.
Saint John's Regional Medical Center
Hospital
min.
min.

Health Care

Pacific Dental Group and Orthodontics
Dentist
min.
min.
Channel Islands Family Dental Office- Oxnard
Dentist
min.
min.

Safety

Oxnard Fire Department Station 4
Fire Station
min.
min.
Fire Station
Fire Station
min.
min.

Top Neighborhood Schools

Name Category Grades Rating
Vista Real Charter High
401 S. A St. Ste. 3, Oxnard, CA
High School 9 - 12 School Score
R.J. Frank Academy Of Marine Science & Engineering
701 N. Juanita Ave., Oxnard, CA
Elementary School 6 - 8 School Score
Oxnard High
3400 W. Gonzales Rd., Oxnard, CA
High School 9 - 12 School Score
Providence
4333 Vineyard Ave., Oxnard, CA
High School KG - 12 School Score
Pacifica High
600 E. Gonzales Rd., Oxnard, CA
High School 9 - 12 School Score
Rio Del Valle Middle
3100 Rose Ave., Oxnard, CA
Elementary School 6 - 8 School Score
Rio Mesa High
545 Central Ave., Oxnard, CA
High School 9 - 12 School Score

Education Level Achieved

Education is a key factor in understanding the character and opportunities within a community like Rio Lindo. School ratings here reflect important indicators such as academic performance, graduation outcomes, and standardized testing, while NAEP (National Assessment of Educational Progress) scores offer a valuable national comparison to gauge how local schools measure up. Looking at the overall education level of residents in Rio Lindo can also provide meaningful insight into the neighborhood’s focus on learning and long-term growth, helping families choose a community that aligns with their educational goals.

Economy

? /10
Income Per Capita $28,192
Household Income $93,233
Unemployment 4.8%

Income Breakdown

Rio Lindo Income breakdown chart

Employment by Industry

Industry Employed
Agriculture & Mining Unlock
Construction Unlock
Manufacturing Unlock
Wholesale & Retail Unlock
Transportation & Warehousing Unlock
Information Unlock
Finance & Insurance Unlock

The economic makeup of a neighborhood often tells a deeper story about its lifestyle, opportunities, and overall character. In Rio Lindo, median household incomes average $93,233, which is higher than many surrounding neighborhoods. This elevated earning power helps support a more upscale environment, offering residents access to premium amenities, well-maintained surroundings, and a standard of living that emphasizes comfort and quality.

The employment landscape offers valuable insight into the stability and economic health of a neighborhood. In Rio Lindo, the unemployment rate sits at around 5%, which is about average compared to many other areas. This balanced rate reflects a steady local economy and a reliable foundation for residents and businesses alike.

Frequently Asked Questions

What types of homes are common?

Rio Lindo features a variety of residential options, predominantly single-family homes built between the 1950s and 1970s. Many houses showcase mid-century architectural styles with well-maintained yards. There are also some newer infill developments and townhomes, but the neighborhood largely retains a classic suburban feel with tree-lined streets and spacious lots.

Are there any community events or local gatherings throughout the year?

Yes, Rio Lindo hosts several community events that foster neighborhood spirit. The Rio Lindo Neighborhood Association frequently organizes seasonal block parties and holiday celebrations, including a popular Fourth of July barbecue and an annual holiday lights contest. Additionally, nearby Rio Lindo Park serves as a venue for local farmers' markets and outdoor movie nights during the summer.

Are there major highways or transit lines nearby?

Rio Lindo benefits from easy access to major transportation routes. The neighborhood is conveniently located near Highway 101, allowing residents to quickly reach Downtown Oxnard and neighboring cities. Public transit options include bus lines operated by Gold Coast Transit, with stops along Rice Avenue and Oxnard Boulevard providing connections to Oxnard Transit Center and Ventura County. This makes commuting and accessing regional attractions relatively straightforward.

Compare Nearby Neighborhoods

Location Overall Amenities Health Transit Schools Housing Economy Crime
Unlock to see 82 68 56 34 44 89 88 61
Unlock to see 75 76 81 53 50 83 58 48
Unlock to see 68 42 77 62 81 62 54 79
Rio Lindo Subscribe Subscribe Subscribe Subscribe Subscribe Subscribe Subscribe Subscribe
Unlock to see 49 39 73 56 63 32 85 74
Unlock to see 36 70 78 38 33 55 66 89
Unlock to see 25 81 65 76 77 58 49 33

Other Neighborhoods in Oxnard, CA