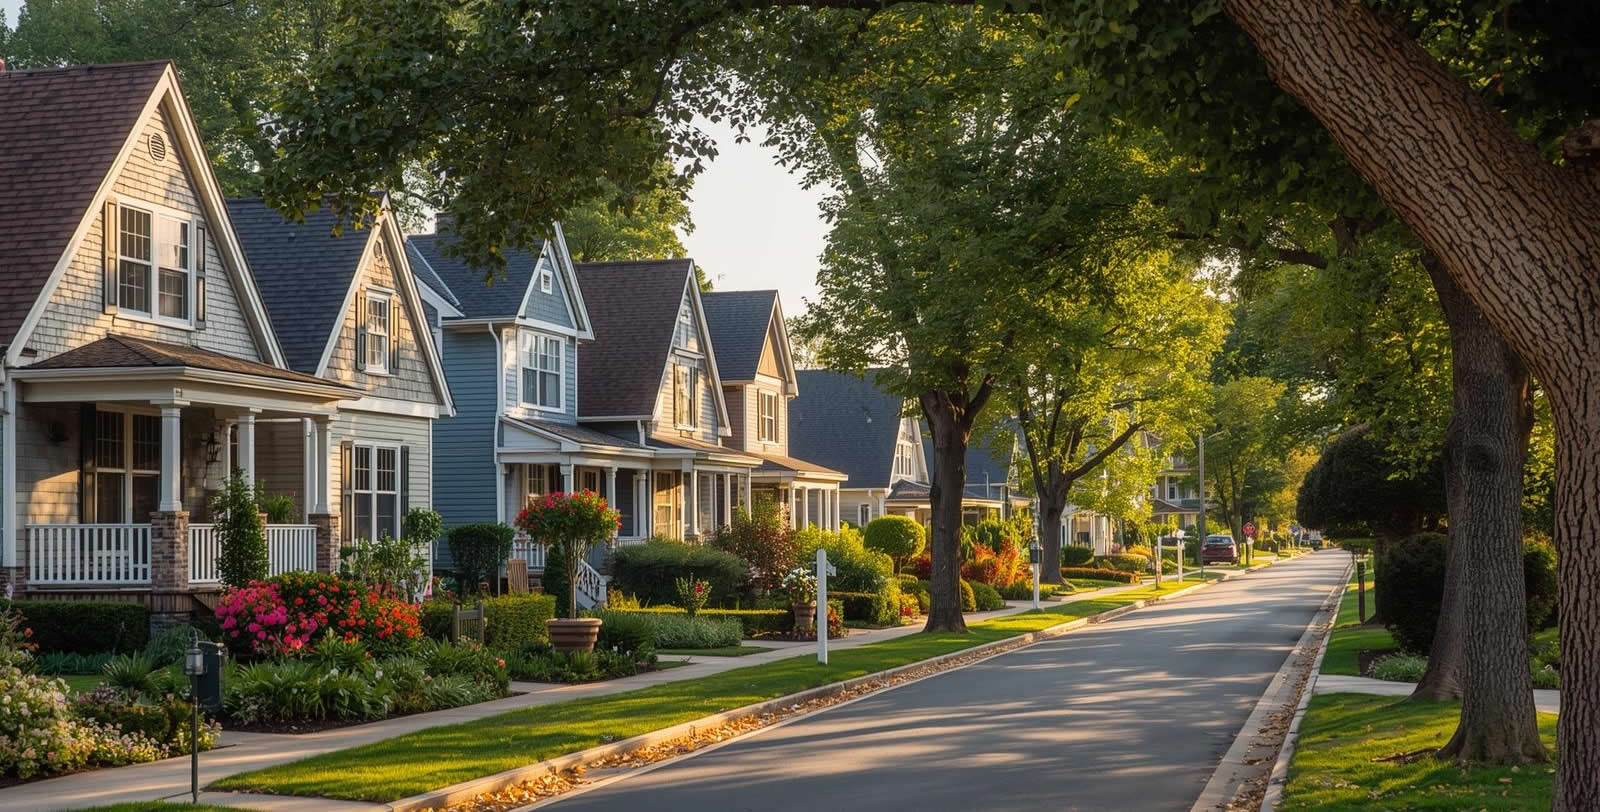
When it comes to choosing where to live, most people start by asking about the house — square footage, price, number of bedrooms. But long after the boxes are unpacked, what often determines whether someone loves where they live isn’t the home itself — it’s the neighborhood. The sense of safety, the walkability, the people, the access to good schools or parks — these are the subtle, everyday qualities that make a place feel right. Yet defining “livability” isn’t as simple as it sounds. What’s livable for one person may feel limiting to another. A quiet suburban street may be perfect for a family with young children, while a bustling downtown block might be heaven for someone who thrives on energy and nightlife. Still, there are certain elements that consistently shape how livable a neighborhood feels, no matter who you are. Let’s take a closer look at what truly makes a neighborhood livable — and how modern tools like Local Insights can help you measure and compare those factors more intelligently than ever before.
The Meaning of Livability
“Livability” is a word that gets thrown around a lot — in real estate listings, on neighborhood websites, even in city planning documents. But what does it really mean? At its core, livability describes how well a place meets the day-to-day needs of its residents. It’s about the blend of comfort, convenience, opportunity, and connection that allows people not just to live somewhere, but to thrive. Traditional definitions often focus on quantifiable aspects like cost of living, employment rates, and safety. But true livability goes deeper — it includes access to culture, the feeling of community, environmental quality, and even how a place makes you feel when you walk down the street. That’s why Local Insights was designed to take the guesswork out of evaluating neighborhoods. Each report pulls together over 300 hyperlocal data points, giving you a complete picture of what life might really be like — from crime and schools to amenities, housing trends, and even commute times — all within a 1-mile radius of any address.

1. Safety and Security
It’s hard to feel at home in a place that doesn’t feel safe. Crime rates remain one of the most important metrics people look at when assessing a neighborhood, and with good reason — perceptions of safety shape everything from how people interact to how property values grow. A livable neighborhood doesn’t necessarily mean one without any crime; rather, it’s one where residents feel secure and supported. Factors like low violent crime, visible community policing, and active neighborhood watch programs all contribute to a sense of safety. Local Insights helps quantify that peace of mind. Instead of broad citywide averages, users can access address-based crime data within a 1-mile radius, clearly showing where crime is concentrated and where it’s trending downward. This hyperlocal lens can reveal pockets of safety that might otherwise go unnoticed — and just as importantly, it helps avoid the misinformation that can come from relying on outdated or anecdotal reports.
2. Access to Amenities
A truly livable neighborhood balances convenience and character. Having essential services close by — grocery stores, pharmacies, gyms, restaurants — makes daily life easier, but amenities also contribute to the area’s identity. A small café can become a neighborhood hub; a local park can define an entire community’s rhythm. Data from Local Insights highlights nearby amenities such as shopping, dining, entertainment, and recreation. These details help users visualize what daily life might look like in a given area — whether that means quick coffee runs in a walkable downtown or family weekends at the local farmers market. Neighborhoods that score high for amenities tend to attract residents who value time efficiency and community engagement. And while it’s easy to underestimate their role, studies consistently show that proximity to amenities correlates strongly with resident satisfaction and even home value growth.
3. Education and Schools
For families — and even for those without children — the quality of nearby schools is often a deciding factor in choosing where to live. Strong school districts signal not just educational opportunity but community investment. They attract stable homeowners, boost local pride, and often drive long-term property appreciation. Livable neighborhoods don’t necessarily have the “best” schools by test scores alone — they have schools that are accessible, well-supported, and connected to the community. Local Insights integrates school ratings, NAEP test performance, and educational attainment levels to provide a clearer, data-driven understanding of local education quality. By comparing schools within a city or even across neighboring districts, families can identify which areas best align with their priorities — whether that’s academic excellence, diversity, or access to special programs.
4. Transportation and Commute
A neighborhood’s livability often hinges on how easily residents can get where they need to go. For some, that means proximity to public transit or major highways. For others, it’s the ability to walk or bike safely to daily destinations. Long commute times can sap energy and limit quality of life, even in otherwise desirable areas. On the other hand, neighborhoods that offer multiple modes of transportation — transit stops, walkable design, and nearby employment centers — allow for greater flexibility and convenience. Local Insights captures these nuances by analyzing commute patterns, transit access, and walkability within a small radius. This helps users compare how each area connects to work, schools, and daily needs — offering a practical look at what “convenience” really means for different lifestyles.
5. Housing and Affordability
Livability also depends on whether people can realistically afford to live in an area without financial strain. That balance between housing cost and local quality of life is one of the hardest to achieve — especially in competitive markets. Livable neighborhoods offer a range of housing options that reflect their diversity. Affordable starter homes, rentals, and higher-end properties can coexist when zoning and development are inclusive. Stability in home values, low vacancy rates, and consistent appreciation over time all indicate a sustainable housing market. Local Insights provides detailed housing data, including median home prices, rent costs, affordability ratios, and 3-year market trends, to help users evaluate the financial side of livability. By viewing data for the immediate area alongside city, state, and national trends, buyers can see whether a neighborhood is growing steadily or potentially overvalued.
6. Economy and Opportunity
Livability is also tied to the local economy — not just in terms of employment rates, but the types of opportunities available. A vibrant job market, diverse industries, and stable small businesses all contribute to community resilience. Neighborhoods with accessible employment centers and thriving local economies tend to have lower turnover and higher satisfaction among residents. Economic diversity, in particular, helps cushion communities during downturns. Local Insights measures income levels, employment rates, and key industries to give users a clear picture of local economic strength. Whether you’re relocating for work or considering a long-term investment, this data helps you assess not just where a neighborhood stands today, but where it might be headed.
7. Community and Social Connection
Beyond numbers and data, the most intangible — yet powerful — element of livability is community connection. A truly livable neighborhood is one where people feel like they belong. That sense of connection often comes from small, daily interactions: chatting with a neighbor, recognizing local business owners, seeing familiar faces at the park. Social trust strengthens safety, increases civic engagement, and builds long-term stability. While these qualities are harder to quantify, Local Insights provides indirect indicators — like length of residency, marital status distribution, and household composition — which together offer clues about how stable or transient an area is. Combined with cultural and event data, these metrics reveal whether a community feels active, rooted, or transitional.
8. Environment and Green Spaces
Access to nature has become one of the most consistent predictors of happiness and health. Green spaces — from large parks to small community gardens — encourage physical activity, reduce stress, and bring people together. Livable neighborhoods integrate nature into daily life, not just as an amenity but as part of the design. Tree-lined streets, walkable paths, and nearby trails all enhance the feeling of balance between urban and natural environments. Local Insights highlights proximity to parks, outdoor recreation areas, and environmental quality scores, helping users visualize how nature fits into the lifestyle of each area.
9. Demographics and Diversity
Diversity is a cornerstone of vibrant, livable neighborhoods. Areas that include residents of different backgrounds, ages, and income levels tend to foster richer experiences, more creative economies, and stronger social networks. Demographic variety often signals inclusivity and resilience — qualities that make neighborhoods better able to adapt over time. Local Insights integrates detailed demographic data, including age, income distribution, education levels, and household types, to help users understand the character and cultural makeup of a neighborhood. These insights go beyond surface-level numbers to paint a picture of who lives there and how the community functions day-to-day.
10. Overall Livability – Bringing It All Together
Each of these elements — safety, housing, amenities, schools, economy, and more — interconnects to create a neighborhood’s overall livability profile. The challenge is that traditional data sources often focus on single dimensions: one site may list crime rates, another shows schools, and yet another has housing stats. That’s why Local Insights was developed: to bring all of these factors together in one easy-to-understand report. Using over 300 unique data points, it translates complex datasets into a clear, intuitive view of what life in a specific neighborhood really looks like. Every address-based report includes a Proximitii Score, summarizing overall livability; category breakdowns for crime, schools, amenities, transit, economy, and housing; a 1-mile radius analysis for hyperlocal accuracy; and easy comparisons between neighborhoods, cities, or ZIP codes. For anyone trying to decide where to move — or for agents helping clients find their ideal community — it’s an indispensable tool for transforming data into confidence.
How to Use Local Insights to Find Your Ideal Neighborhood
Finding a livable neighborhood isn’t just about data — it’s about alignment. The best neighborhood for you depends on how those metrics match your lifestyle priorities. For example, a retiree might value safety and healthcare access above all else. A young family might focus on schools and parks. A professional might care more about transit and amenities. Local Insights allows users to filter and compare those variables side by side, so you can see which neighborhoods truly fit your life. Here’s how many users apply it: start with an address or city to generate a livability report; review the Proximitii Score; compare neighborhoods side by side; explore 3-year housing and market trends; and decide with clarity. Whether you’re relocating across the country or just across town, that level of insight can make all the difference between uncertainty and confidence.
Why Livability Will Matter Even More in the Future
As cities evolve and remote work reshapes where people choose to live, livability is becoming the new real estate currency. Buyers and renters are no longer just chasing square footage — they’re searching for connection, safety, opportunity, and quality of life.
Proximitii features Neighborhood Guides for more than 500 cities across the United States, giving users an easy way to explore what life is like in each area. These guides provide essential neighborhood data including amenities, crime, demographics, economy, housing, and schools, allowing anyone to get a clear snapshot of what makes each community unique. For those who want to go deeper, Local Insights takes it a step further — offering address-based data within a one-mile radius, so users can uncover hyperlocal trends and make confident decisions at the street level.
Data-driven tools like Local Insights help bridge that gap between perception and reality. They allow people to make decisions based on facts, not assumptions — whether that means discovering an underrated neighborhood or confirming that a community truly aligns with their goals. In the end, a livable neighborhood is one that supports your life, not just your address. It’s a place where data meets experience — and where every insight helps you find the perfect place to call home.

