Choosing a place to live is about more than just square footage or curb appeal. It’s about community, convenience, safety, opportunity, and overall quality of life. That’s exactly what the Proximitii Score is designed to capture. In a world where homebuyers and renters are overwhelmed by options, the Proximitii Score distills hyperlocal data into a single, easy-to-understand number that reflects the livability of a specific neighborhood. But what goes into that number? And why should you trust it when making such a major life decision?
Let’s explore what makes the Proximitii Score unique, how it works, and why it matters more now than ever.
What Is the Proximitii Score?
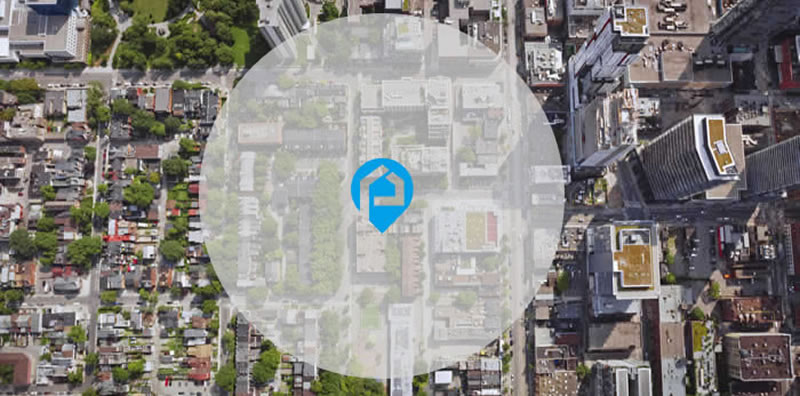
At its core, the Proximitii Score is a data-driven representation of a neighborhood’s livability based on over 300 hyperlocal data points. It combines a wide range of variables that influence daily life—everything from crime rates and school quality to nearby amenities, commute options, and economic trends. Unlike generic citywide ratings, the Proximitii Score focuses on a small radius (typically not more than 2 miles) around a specific address, giving users an ultra-local look at what it’s like to actually live in a given spot.

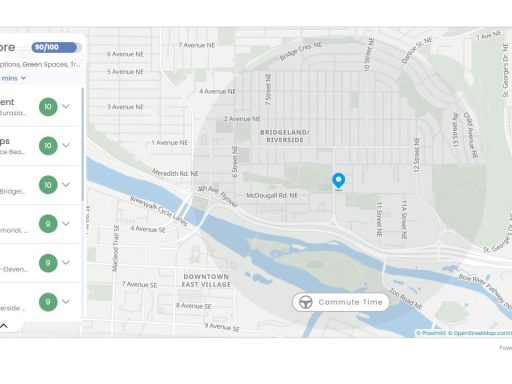
The score is calculated using weighted data across several core categories: amenities, crime, schools, housing, economy, health, and transit. Each of these elements contributes to the overall experience of living in a place. Instead of relying on broad generalizations, the Proximitii Score pulls in precise, localized data so users can make informed decisions about where to live.
Why Livability Is More Than a Buzzword
Livability is one of those concepts that seems intuitive, but is surprisingly complex when you try to define it. What makes a neighborhood livable for one person might not be the same for someone else. For a young professional, it might mean proximity to nightlife and transit. For a family, it might be top-rated schools and low crime. For retirees, it could be healthcare access and walkable parks. The beauty of the Proximitii Score is that it pulls from diverse factors that impact all these different needs, offering a rounded view of neighborhood quality.
Livability isn’t about luxury or status. It’s about how well a place supports your everyday life. Can you get to work easily? Are there parks or coffee shops within walking distance? Do you feel safe after dark? Are there good schools and stable housing values? These are the kinds of questions the Proximitii Score is built to answer.
The Core Categories Behind the Score
Each Proximitii Score is powered by multiple data categories that reflect how people experience their neighborhoods.
![]()
For example, the amenities category looks at how close you are to grocery stores, cafes, restaurants, shops, public parks, and other everyday essentials. This isn’t just about what’s nearby, but how accessible and diverse those resources are.
The crime category takes a deep dive into both city-wide and hyperlocal crime rates, highlighting both violent and property crimes in the immediate area. Rather than relying on just citywide statistics that often skew perceptions, Proximitii uses recent, address-specific crime data to help users understand real safety concerns.
Schools are another major component, especially for families. The education data includes school ratings, proximity to schools, and district performance metrics. Whether you’re planning for kids or considering resale value, school quality remains a critical factor in neighborhood desirability.
Housing and economic data also play a major role. This includes housing affordability, home value trends, rental availability, job growth, income levels, and overall economic stability. Together, these indicators give a sense of how strong and sustainable the community is, both now and in the future.
Transit and commute data round out the score. Whether it’s public transportation availability, average commute time, or walkability, these insights help users evaluate how easy it is to get around on a daily basis.
Why Hyperlocal Data Matters
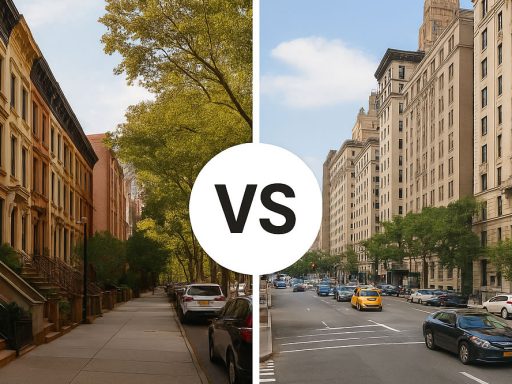
One of the biggest differentiators of the Proximitii Score is its commitment to hyperlocal data. A city or ZIP code can only tell you so much. Real life happens at the street level. Two homes just a few blocks apart can exist in completely different micro-environments in terms of safety, amenities, and community feel. That’s why Local Insights reports are generated using data pulled from a small radius around a specific address. It’s neighborhood-level accuracy with a real-world lens.
By narrowing the focus, users get a more relevant and useful view of the area they’re actually considering. You’re not just seeing what the city is like; you’re seeing what your block is like. And when it comes to choosing where to live, that specificity can be the difference between loving your new home or regretting the move.
How the Score Helps Buyers and Renters
The Proximitii Score isn’t just a number. It’s a shortcut to clarity. For buyers, it offers a deeper understanding of the lifestyle they’re buying into, not just the property. It helps them evaluate trade-offs between different areas and feel more confident in their choices. For renters, especially those relocating to new cities, the score can quickly highlight which neighborhoods align with their priorities.
Even for seasoned agents, the Proximitii Score is a powerful tool. It provides hard data that can back up local knowledge and enhance client trust. When you can point to specific neighborhood strengths with facts to support them, you build credibility and help clients move forward with confidence.
Livability in Action: More Than Just a Score
What makes the Proximitii Score so effective is that it doesn’t try to define livability for you. Instead, it gives you the tools to evaluate what livability means for your life. The report doesn’t just show one number and call it a day. It breaks down each contributing factor with context, data points, and comparisons. You can see why an area scored the way it did, and whether that aligns with what you’re looking for. Here’s a real life use case on how the Proximitii Score helped with a new home search.

When Melissa and Jordan, a young couple relocating from Chicago to Nashville, began their home search, they were overwhelmed by the number of neighborhoods that looked great on the surface but varied widely in vibe, safety, and amenities. Their agent introduced them to Local Insights, and specifically the Proximitii Score, to help them make a more informed decision. After reviewing reports for five potential addresses, they noticed one area stood out with a high score in amenities, schools, and community stability—something they hadn’t picked up on during online searches. The detailed data also showed lower crime within a one-mile radius compared to a trendier neighborhood they were considering. With that insight, they confidently chose a home in an area that aligned with their lifestyle and future plans.
Why Now Is the Time to Trust the Data
With rising housing costs, limited inventory, and shifting priorities post-pandemic, people are thinking differently about where they want to live. Remote work has opened up new areas, and lifestyle alignment has taken center stage. In this environment, relying on assumptions, old data, or gut instinct isn’t enough.
The Proximitii Score empowers people to make decisions with data that’s timely, relevant, and hyperlocal. Whether you’re a first-time buyer, a family relocating, or a real estate professional advising clients, understanding the full picture of a neighborhood is more important than ever. And thanks to the insights behind the Proximitii Score, that picture is finally clear.
The right neighborhood isn’t just about location. It’s about connection, comfort, opportunity, and lifestyle. The Proximitii Score is your guide to finding it.


