When Arena Rankings Meet Neighborhood Reality
Every NHL season sparks debates about which arenas deliver the best fan experience. Rankings often focus on atmosphere, sightlines, food options, history, and the overall feel inside the building. But there’s another factor that quietly shapes how fans experience a game night: the neighborhood surrounding the arena.
From pregame dinners and postgame bars to walkability, transit access, and the general energy of the area, the setting outside the rink can matter just as much as what happens inside. That raises an interesting question: Do the NHL’s best-rated arenas also sit in the best neighborhoods?
To explore this, we looked beyond traditional arena rankings and layered in Proximitii Scores, which measure neighborhood livability based on walkability, transit access, restaurants, bars, parks, coffee shops, fitness facilites, and more. The result is a more complete picture of how arena experience and neighborhood quality intersect.
| Rank | Arena | Writers' Rank | Fan Rank | Final Score | Proximitii Score |
|---|---|---|---|---|---|
| 1 | Bell Centre | 1 | 1 | 9.0 | 9.6 |
| 2 | T-Mobile Arena | 3 | 3 | 8.6 | 5.7 |
| 3 | Benchmark Int. Arena | 12 | 2 | 8.3 | 7.8 |
| 4 | Bridgestone Arena | 7 | 5 | 8.2 | 7.0 |
| 5 | Little Caesars Arena | 5 | 8 | 8.0 | 8.7 |
| 6 | Nationwide Arena | 15 | 4 | 8.0 | 7.8 |
| 7 | Grand Casino Arena | 4 | 9 | 8.0 | 8.6 |
| 8 | Climate Pledge Arena | 11 | 7 | 7.9 | 9.2 |
| 9 | UBS Arena | 18 | 6 | 7.8 | 6.3 |
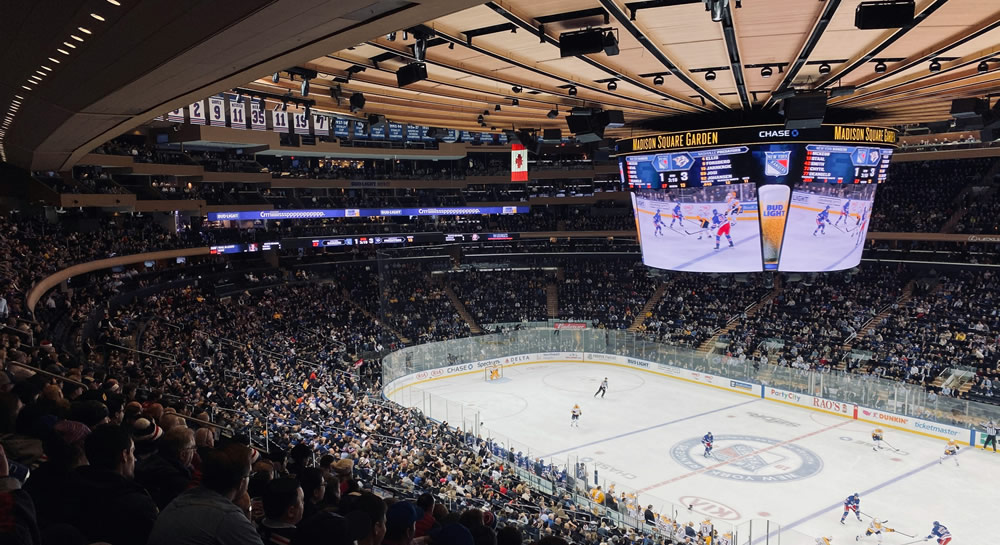
| 10 | Madison Square Garden | 2 | 20 | 7.7 | 9.6 |
| 11 | Rogers Place | 8 | 10 | 7.7 | 9.5 |
| 12 | United Center | 9 | 16 | 7.6 | 9.0 |
| 13 | Canada Life Centre | 10 | 13 | 7.6 | 9.3 |
| 14 | American Airlines Center | 20 | 15 | 7.3 | 7.1 |
| 15 | Enterprise Center | 27 | 11 | 7.3 | 8.3 |
| 16 | Amerant Bank Arena | 25 | 14 | 7.2 | 3.9 |
| 17 | Ball Arena | 23 | 17 | 7.2 | 8.3 |
| 18 | TD Garden | 6 | 22 | 7.2 | 9.0 |
| 19 | Lenovo Center | 23 | 18 | 7.1 | 3.1 |
| 20 | SAP Center | 29 | 12 | 7.1 | 7.8 |
| 21 | Delta Center | 28 | 19 | 6.9 | 7.9 |
| 22 | Xfinity Mobile Arena | 26 | 21 | 6.8 | 3.9 |
| 23 | PPG Paints Arena | 19 | 24 | 6.7 | 8.5 |
| 24 | Prudential Center | 31 | 23 | 6.4 | 8.6 |
| 25 | Scotiabank Saddledome | 13 | 27 | 6.3 | 9.2 |
| 26 | Honda Center | 30 | 25 | 6.3 | 3.9 |
| 27 | Capital One Arena | 16 | 26 | 6.3 | 9.5 |
| 28 | Scotiabank Arena | 13 | 30 | 5.8 | 9.5 |
| 29 | Rogers Arena | 17 | 28 | 5.8 | 9.5 |
| 30 | Crypto.com Arena | 20 | 29 | 5.7 | 9.3 |
| 31 | KeyBank Center | 20 | 31 | 5.7 | 6.3 |
| 32 | Canadian Tire Centre | 32 | 32 | 4.9 | 5.8 |
Note: Rankings are based on survey responses evaluating NHL arenas across location, amenities, atmosphere, affordability and overall experience, along with respondents’ assessment of each arena’s league-wide standing. Results were combined with beat writer rankings to produce a final composite score, shown on a 10-point scale.
Source: The Athletic NHL arena survey and analysis
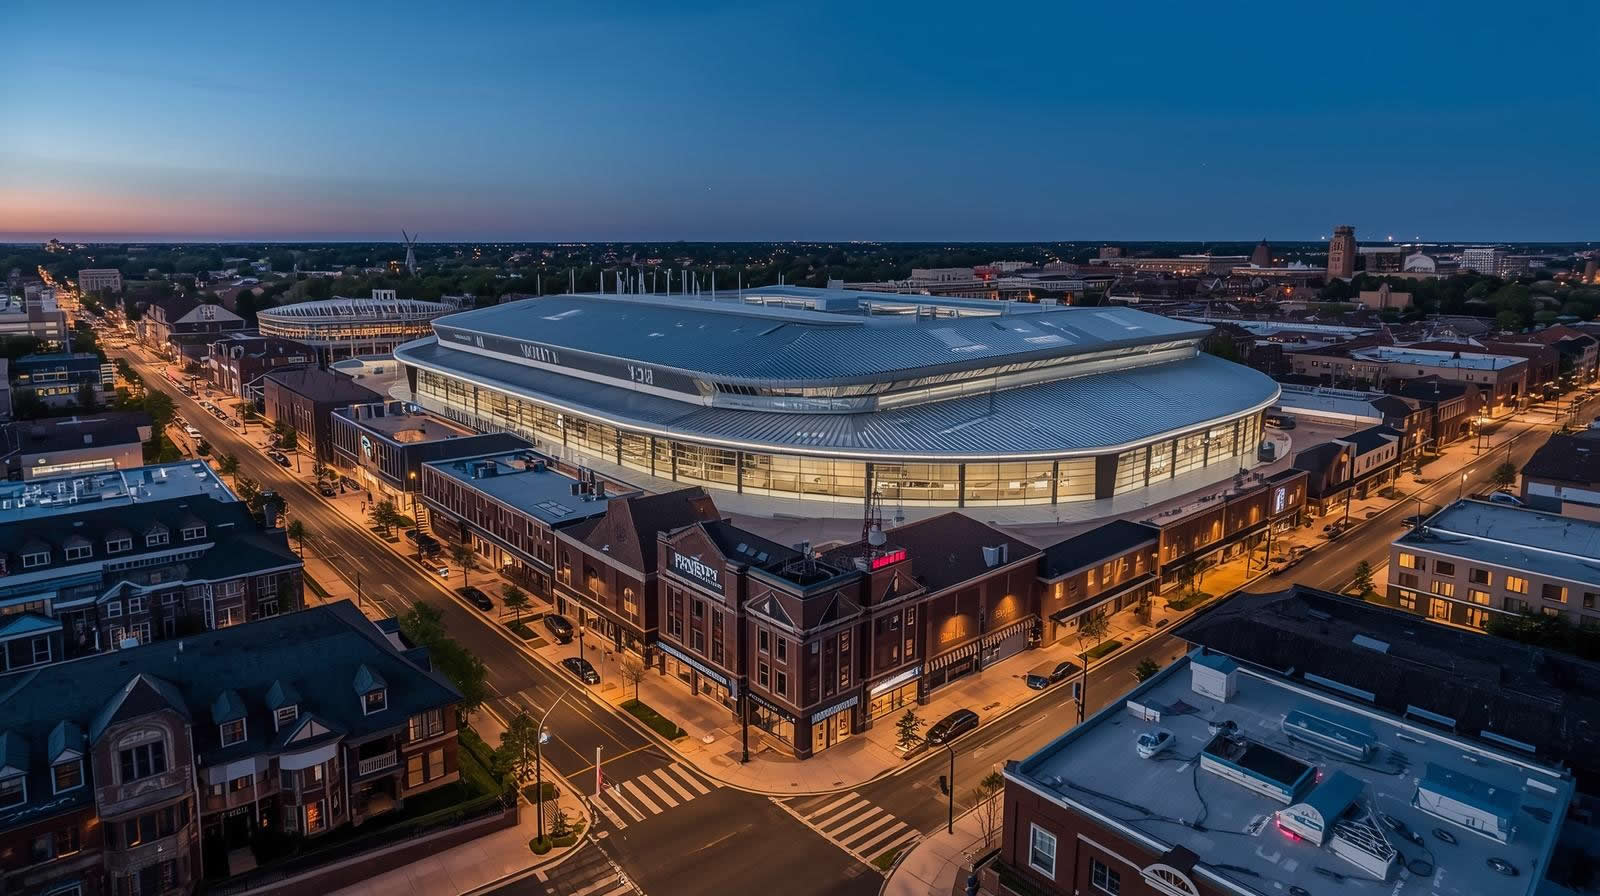
Why Neighborhoods Matter on Game Night
An arena rarely exists in isolation. Fans don’t teleport in and out—they arrive early, linger after games, meet friends nearby, and navigate the surrounding streets. Arenas located in dense, mixed-use neighborhoods tend to offer:
-
Walkable access to restaurants, bars, and entertainment
-
Strong transit connections that reduce the need to drive
-
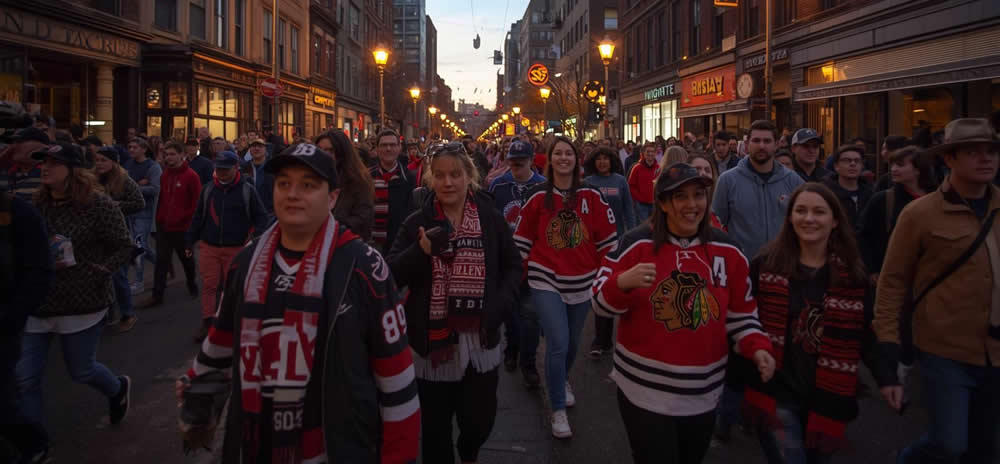
Lively streets that feel active before and after games
-
A sense of place that extends the experience beyond the final horn
In contrast, arenas surrounded primarily by parking lots or highways may still deliver a great in-arena product, but the broader experience often feels more limited.
This is where Proximitii Scores add valuable context, capturing the everyday livability of the areas NHL arenas call home.
Where Arena Rankings and Proximitii Scores Align
Looking at the data, there are several clear cases where highly rated arenas are also located in highly livable neighborhoods. These tend to be arenas embedded in established urban cores.
Examples include downtown venues where fans can walk to the game, hop on transit, or build an entire evening around the event. In these locations, strong Proximitii Scores reflect exactly what fans praise: convenience, energy, and accessibility. The neighborhood reinforces the arena’s reputation rather than competing with it.
This alignment suggests that when an arena is placed in a walkable, amenity-rich area, it enhances not just daily livability for residents, but also the perceived quality of the arena itself.
When Great Neighborhoods Don’t Guarantee Top Arena Rankings
Interestingly, the relationship isn’t one-to-one. Some arenas sit in excellent neighborhoods with very high Proximitii Scores, yet rank lower in overall arena evaluations.
In these cases, the surrounding area excels in walkability, transit access, and lifestyle amenities, but the arena may lag due to factors unrelated to location—such as age, design limitations, or in-arena features. This highlights an important distinction: neighborhood quality can elevate the overall experience, but it can’t fully compensate for shortcomings inside the building.
For fans, this often means the game night feels enjoyable before and after the event, even if the arena itself isn’t considered top tier.
The Correlation: Final Score vs. Proximitii Score
When comparing Final Arena Scores with Proximitii Scores, the data shows a moderate—but meaningful—relationship between arena quality and neighborhood livability.
Across the full dataset, about 55% of arenas with above-average Final Scores are also located in above-average Proximitii Score neighborhoods. In other words, top-rated arenas are more likely than not to sit in livable, walkable areas—but it’s not a guarantee.
Looking from the neighborhood side tells a stronger story. Nearly 70% of arenas located in high Proximitii Score neighborhoods fall within the top half of overall arena rankings, suggesting that strong walkability, transit access, and surrounding amenities consistently support better fan experiences.
At the lower end, the contrast is sharper. Over 65% of arenas in low Proximitii Score neighborhoods rank in the bottom half of Final Scores, and fewer than 30% of them achieve an above-average arena rating. Car-dependent or isolated locations appear far less likely to host top-tier fan experiences.
What the data does not show is a direct, one-to-one relationship. Several arenas in excellent neighborhoods receive only mid-range Final Scores, while a handful of highly rated arenas perform well despite more modest Proximitii Scores. That reinforces a key point: arena rankings are driven by many factors beyond location.
The takeaway is clear and balanced: neighborhood quality doesn’t determine arena rankings—but it meaningfully improves the odds. Great neighborhoods don’t guarantee great arenas, but they consistently help elevate the overall experience on game night.
What This Means for Fans, Cities, and Real Estate
For fans, the takeaway is simple: some of the best game nights happen in places where the neighborhood itself is part of the attraction. The ability to walk to dinner, explore nearby streets, or rely on transit can meaningfully shape how memorable a game feels.
For cities, the data reinforces a growing trend in arena development: integration matters. Arenas woven into walkable, mixed-use districts tend to age better and remain active year-round, not just on game nights.
For homebuyers and renters, proximity to an NHL arena in a high-scoring Proximitii neighborhood often signals broader neighborhood strengths—access to amenities, strong transit, and vibrant street life—factors that matter well beyond hockey season.
The Bigger Picture
So, do the NHL’s best arenas sit in the best neighborhoods? Not always—but the strongest arenas and the most livable neighborhoods frequently overlap.
Arena rankings tell us how a building performs on game night. Proximitii Scores reveal how the surrounding area functions every day. When both align, the result is a place that feels special whether there’s a game on or not.
In the end, the data suggests that arena experience and neighborhood livability are complementary, not interchangeable. Great arenas benefit from great neighborhoods, and great neighborhoods can elevate the entire sports experience—one block, one bar, and one game night at a time.