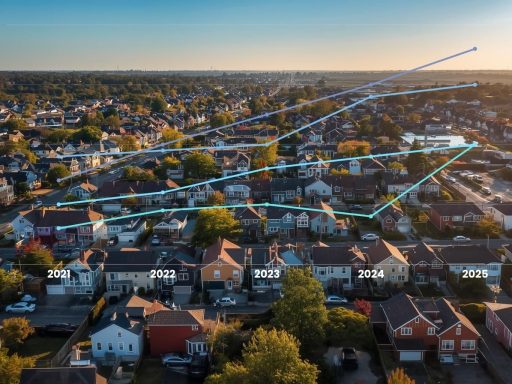
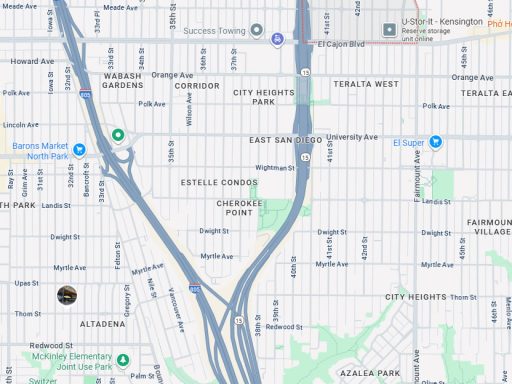
In August 2025, the FBI released its “Reported Crimes in the Nation” statistics for 2024, revealing encouraging signs: a national decline in violent crime by 4.5% compared to 2023. The report shows significant decreases in several major categories, including murder (–14.9 %), rape (–5.2 %), aggravated assault (–3.0 %), and robbery (–8.9 %). These numbers suggest a turning point for communities across the country, with notable improvements in public safety and law enforcement outcomes.
But while the data paints an optimistic picture overall, crime trends are rarely uniform. Some areas are improving faster than others, and in certain places, local conditions may even be moving in the opposite direction. To understand what the national decline really means, it’s essential to dig deeper—beyond the headlines and into the local stories behind the numbers.
What the 2024 FBI Data Reveals
According to the FBI, the 2024 dataset includes over 14 million reported offenses from more than 16,000 law enforcement agencies, covering jurisdictions representing approximately 95.6% of the U.S. population. These figures give one of the clearest pictures yet of how crime patterns are evolving across the country.
Here’s what the 2024 report shows at a glance:
-
Murder and non-negligent manslaughter: down 14.9%
-
Rape: down 5.2% (under the revised definition used since 2017)
-
Aggravated assault: down 3.0%
-
Robbery: down 8.9%
-
Hate crimes: down about 1.5%, from 11,041 incidents in 2023 to 10,873 in 2024
These trends suggest that violent crime overall decreased for the second consecutive year, reflecting broad improvements in law enforcement effectiveness and community engagement. However, it’s important to remember that national averages can hide as much as they reveal.
Crime Breakdown (per 100,000 people)
| Type | 2023 | 2024 |
|---|---|---|
| Total Crime | 2,280 | 2,119 |
| Violent Crimes | 363 | 359 |
| Murder | 5.7 | 5 |
| Rape | 38 | 37.5 |
| Robbery | 66.5 | 60.6 |
| Assault | 264.1 | 256.1 |
| Property Crimes | 1916.7 | 1760.1 |
| Burglary | 250.7 | 229.2 |
| Theft | 1347.2 | 1272.1 |
| Vehicle Theft | 318.7 | 282.8 |
What’s Driving the Decline in Crime?
National crime rates tend to shift due to a combination of social, economic, and institutional factors. Here are some that likely contributed to 2024’s downward trends.
1. Smarter, Data-Driven Policing
Law enforcement agencies have increasingly turned to predictive analytics and hot-spot policing, allowing them to deploy resources more efficiently. By focusing on high-risk areas and times, departments can prevent crimes before they escalate.
2. Community-Centered Programs
Cities investing in violence interruption programs, youth engagement, and neighborhood outreach often see tangible results. These programs help address the root causes of violence, such as poverty and lack of opportunity, rather than reacting only after crimes occur.
3. Economic Stability and Recovery
As post-pandemic recovery continues, unemployment has fallen and many communities have regained economic stability. A stronger economy generally correlates with fewer property crimes and some categories of violent crime.
4. Shifting Demographics
Population aging, migration, and urban redevelopment can all reshape neighborhood safety. Areas with an older average age, for instance, tend to experience lower violent crime rates.
5. Improved Reporting and Transparency
While better reporting may sometimes inflate totals, it also helps agencies identify and address issues faster. More complete data collection through NIBRS (the National Incident-Based Reporting System) makes trend analysis more reliable than in previous decades.
Why the Decline Doesn’t Mean Every Area Is Safer
Despite the positive national trend, local disparities remain sharp. Some cities have seen violent crime rise even as the nation improves, and others are struggling with different kinds of offenses—particularly property crime, vehicle theft, and fraud.
There are several reasons for these discrepancies:
-
Regional economic gaps: Income inequality and housing instability can maintain pockets of high crime even within otherwise improving regions.
-
Reporting variations: Some agencies still under-report or delay data submissions, skewing year-to-year comparisons.
-
Urban vs. rural dynamics: Large cities may show faster declines due to concentrated interventions, while smaller towns may lag.
-
Policy differences: Local law enforcement policies, bail reforms, or prosecution priorities can all affect how crime is recorded and perceived.
Ultimately, these inconsistencies highlight why relying solely on national statistics can be misleading. To truly understand safety and risk, you need data at the local and neighborhood level.
Looking at Local and Neighborhood Trends
For residents and homebuyers, national averages don’t tell the whole story. The real question isn’t “Is crime down in the U.S.?” but “Is crime down in my neighborhood?”
Local data allows you to see how your community fits within broader trends. Looking at crime by block group or ZIP code reveals where improvements are strongest—and where more attention is needed. Metrics like year-over-year crime change, incidents per 1,000 residents, or crimes per square mile are key to understanding whether your specific area is moving in a safer direction.
That’s exactly where Local Insights becomes invaluable.
How Local Insights Brings Crime Data Closer to Home
While the FBI’s national data gives a broad overview, it doesn’t help much when you’re trying to decide whether a particular street or neighborhood feels safe. Local Insights fills that gap by providing both city-level and hyperlocal crime data within a 1-mile radius of any address in the U.S.
Using over 300+ data points, Local Insights makes it easy to see how one neighborhood compares to another—showing total crimes, violent versus property offenses, and multi-year trends at the block level. Users can spot whether crime is decreasing faster in one community than another, helping homebuyers, renters, and real estate agents make smarter, more confident decisions.
More importantly, Local Insights turns what could be overwhelming data into actionable context. It bridges the gap between national FBI trends and the street-by-street realities that shape everyday life. Whether you’re analyzing crime near a potential investment property or tracking how safety has changed in your own neighborhood, it gives you a clear, visual understanding of what’s really happening nearby.
How Communities Can Keep the Momentum Going
The 2024 decline in violent crime is encouraging, but it’s not self-sustaining. To continue the trend, local governments, law enforcement, and residents all play a part.
Invest in prevention. Communities that combine law enforcement with proactive support—like mental health services, youth programs, and job training—tend to see more lasting reductions.
Enhance transparency. Public dashboards and open data portals help residents hold institutions accountable and participate in solutions.
Foster connection. Neighborhood watch programs, block parties, and regular community meetings strengthen the social fabric that discourages crime.
Leverage technology. Tools like Local Insights empower both individuals and professionals to stay informed about neighborhood safety and trends in real time.
Why Market Stability and Safety Are Linked
A lesser-discussed benefit of falling crime rates is their impact on property values and neighborhood desirability. Areas that show consistent safety improvements tend to attract new residents, businesses, and investment—fueling a cycle of growth.
Conversely, when crime rises or perceptions of safety weaken, housing demand softens and values can stagnate. This feedback loop means that crime data isn’t just a law enforcement metric—it’s also a critical signal for investors, developers, and families choosing where to live.
For real estate professionals, having access to up-to-date neighborhood safety data gives clients confidence and helps position listings competitively. For everyday buyers, it adds context that goes beyond listing photos and price points.
What to Watch Heading into 2025
The key question for 2025 is whether these downward trends will hold. Economists and criminologists will be watching several indicators closely:
-
Will homicide rates continue their sharp decline, or flatten out?
-
How will economic fluctuations and population growth affect urban safety?
-
Will data transparency improve as more agencies fully adopt NIBRS reporting?
-
Will technology and predictive analytics help replicate success in slower-to-improve regions?
If 2024 was the first true step toward a safer decade, 2025 will test how durable that progress really is.
A Closer, Smarter Look at Safety
The decline in violent crime in 2024 is more than a statistical win—it’s a sign that targeted strategies, community engagement, and greater data transparency are making a measurable difference. Yet, it also reinforces a key truth: national trends only matter when they reflect what’s happening locally.
That’s why tools like Local Insights are changing how we understand livability and safety. By bringing granular crime data directly to consumers and professionals, they turn national headlines into local knowledge. Whether you’re buying a home, advising clients, or simply curious about your neighborhood, being able to view crime data within a 1-mile radius helps ensure you’re basing decisions on facts—not assumptions.
As 2025 begins, one thing is clear: the nation is moving in a positive direction, and informed, data-driven communities will be the ones that keep that momentum alive.


