
When it comes to complex world of real estate investing, one of the most important questions you can ask is simple: Will this property grow in value over time? While no one has a crystal ball, one of the most reliable indicators of future performance is something we already have — the area’s historical market trends. Looking back at how home values and local conditions have changed over time can reveal powerful clues about a neighborhood’s long-term potential, stability, and growth trajectory.
Whether you’re a first-time homebuyer trying to build equity or an investor searching for your next opportunity, understanding past market trends can help you make smarter, more confident decisions. Here’s why those trends matter — and how to use them to your advantage.
Why Market Trends Matter in Real Estate
Market trends tell the story of how a neighborhood’s housing market has evolved over time. They reflect shifts in home values, demand, inventory, and broader economic conditions. A steady upward trend in property values often signals strong demand and lasting appeal, while erratic patterns can indicate volatility or an area in transition.
Studying past market trends offers a valuable snapshot of how a neighborhood performs across different market conditions. If property values have consistently climbed over the past 3, 5 or 10 years, it’s a strong sign that the neighborhood offers enduring appeal — the kind that attracts buyers, sustains demand, and delivers long-term returns.
For investors and homeowners alike, this matters because market trends aren’t just numbers — they represent real growth potential. A property in a neighborhood with a long history of steady value gains is more likely to appreciate further, protecting your investment and building wealth over time.
What Past Trends Can Reveal About the Future
A simple percentage increase in property values is helpful, but the pattern behind the data is even more revealing. Neighborhoods with consistent year-over-year growth are often safer bets than those with sharp ups and downs. Steady growth points to stable demand and strong fundamentals, while volatility may indicate speculative interest or shifting desirability.
How a neighborhood performs during economic downturns is another key factor. Areas that recover quickly after market slowdowns tend to have strong foundations — such as good schools, reliable infrastructure, quality amenities, and proximity to jobs — all of which drive long-term demand.
It’s also important to distinguish between short-term spikes and sustained growth. A sudden jump in property values might indicate temporary demand, whereas a steady rise over 5–10 years shows deeper, more sustainable growth rooted in lasting appeal.
How Local Factors Shape Market Trends
Market trends don’t happen in isolation. They’re influenced by a wide range of local factors that determine how attractive a neighborhood is to potential buyers. By combining historical data with other local insights, you can better understand why trends are moving in a certain direction — and whether they’re likely to continue.
Job growth and new business development often drive demand, pushing property values higher. Infrastructure improvements — like new transit lines, parks, and schools — enhance livability and increase an area’s appeal. Crime rates and school performance can significantly shape long-term desirability, while local amenities and walkability can transform a once-overlooked neighborhood into a highly sought-after market.
When you layer these factors onto past market trends, you gain a clearer understanding of whether an area’s growth trajectory is built on solid, lasting fundamentals or if it’s likely to plateau.
How to Use Historical Trends to Guide Your Decisions
Historical market trends are more than just historical data — they’re a powerful decision-making tool. They help identify undervalued neighborhoods where growth is accelerating faster than nearby areas, pointing to emerging markets with strong potential. They allow you to weigh risk versus reward, revealing which areas offer stable, steady growth and which present higher potential returns but more volatility.
They can also guide your timing. If a neighborhood’s growth has temporarily slowed but its fundamentals remain strong, that may signal an opportunity to buy before the next upward cycle. Comparing market trends across multiple neighborhoods can also help you pinpoint where your investment is most likely to grow over time.
Why Historical Trends Are a Strong Starting Point
While historical market trends offer valuable insight, they’re not a guarantee of future performance. Real estate markets evolve, new developments reshape demand, and macroeconomic factors like interest rates and migration patterns can influence property values.
Still, ignoring historical data is like investing in a company without ever reviewing its financial history — you miss critical context about performance patterns that could guide smarter decisions. The most successful buyers and investors pair historical market trends with real-time data — including demographic changes, job growth, and new development — to get a complete picture of a neighborhood’s future potential.
How Local Insights Makes This Easier
Manually collecting and analyzing historical market data can be time-consuming and complex. That’s where tools like Local Insights come in. With access to multi-year housing trends, price growth patterns, and market performance data for any address, plus valuable context like crime, schools, and demographics, Local Insights helps you quickly see how an area has evolved — and whether that momentum is likely to continue.
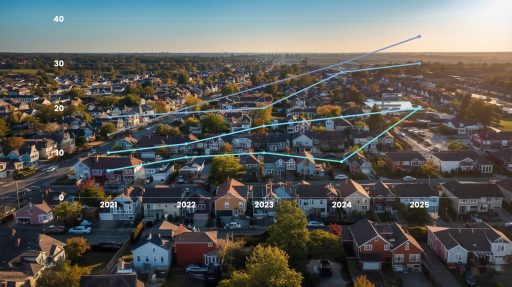
To make this process even more powerful, Local Insights now includes a dedicated Market Trends section that tracks home prices over a three-year period. This feature doesn’t just show broad averages — it breaks down pricing trends at multiple levels: the exact location you searched (hyperlocal), the surrounding city, the state, and the national average. By comparing how home values have shifted across these different scales, you can quickly see how a specific neighborhood stacks up against larger markets. This context can highlight areas that are outperforming the broader market or reveal neighborhoods that may be undervalued and poised for growth.
Instead of relying on guesswork or broad, citywide reports, you get hyperlocal trend data that shows how specific neighborhoods have performed over time. Combined with side-by-side comparisons and neighborhood scores, that data becomes a powerful tool for identifying areas with the strongest potential for long-term value growth.
What This Means for You
Past market trends are one of the most valuable tools for predicting a neighborhood’s future potential. They don’t just reflect how property values have changed — they reveal demand patterns, community strength, and the underlying fundamentals that fuel long-term growth.
By studying how an area has performed historically and combining that knowledge with current local data, you can make smarter decisions about where to buy, when to invest, and how to maximize your return. Whether you’re a first-time homebuyer or a seasoned investor, understanding historical market trends gives you a clear advantage — helping you spot opportunities others overlook and act on them with confidence.