
Crime activity overlay
Place the returned PNG tiles over your existing basemap to show geographic variation in reported activity.
Crime context, directly on your map
Help visitors explore how reported crime activity varies across an area. Add a visual risk layer to the property and neighborhood maps they already use on your site.
api.proximitii.com/v1/crime-riskmap/
Request PNG tiles through your server for an overlay in your existing web map.
An added layer of local context
The API gives your map a crime risk layer, not a finished widget. Your server requests each visible PNG tile with your API keys and passes the image to your existing mapping interface.
GET /v1/crime-riskmap/?z=14&x=4825&y=6156

Public-Key: YOUR_PUBLIC_KEY
Private-Key: SERVER_SIDE_PRIVATE_KEY

200 OK
Content-Type: image/png
X-Cache: MISS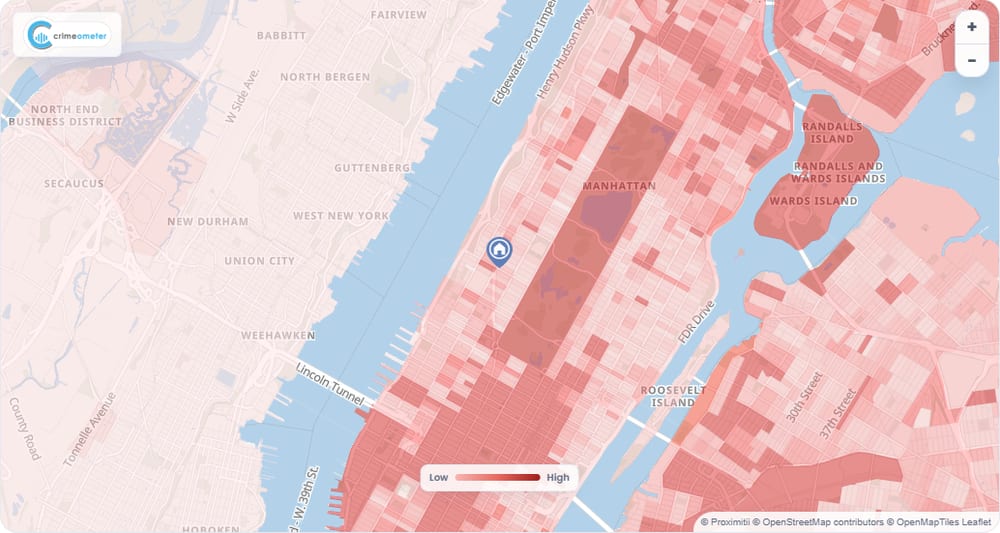
Illustrative map-layer view. Your site controls the basemap, markers and surrounding interface.
Tile values are illustrative. Successful requests return PNG images, not JSON. Show Crime data: CrimeoMeter and your basemap provider's attribution with the map.

What the API provides
Add visual crime context without replacing the maps or location tools already in your experience.
Place the returned PNG tiles over your existing basemap to show geographic variation in reported activity.
Keep the zoom, property pins and other map controls you already provide to visitors.
Request the tiles visible at the current zoom and map position as visitors pan and explore.
Display Crime data: CrimeoMeter alongside the attribution required by your basemap.

Built for real estate maps
Let people view nearby crime activity while they explore a property or compare areas. The overlay gives them geographic context without reducing a neighborhood to a single safety label.
Show activity around the listing location while keeping the property marker and familiar map controls in place.
Let visitors explore the overlay as they move between neighborhoods and search results.
Add a visual layer to area pages alongside lifestyle, demographic and other local data.
Straightforward to integrate
Add a tile route to your backend and connect it to your map library. Your server sends both Proximitii keys with every tile request, then passes the PNG to the browser. No browser tile session is needed.
Read the full API referenceGET https://api.proximitii.com/v1/crime-riskmap/?z={z}&x={x}&y={y}Public-Key and Private-Key headers on every server-side tile requestz, x and y; API zoom levels 0 to 22lat and lon to request a single tileKeep API keys on your server. Apply your usual access control and rate limiting to the tile route.
A clearer view of the surrounding area
Tell us how visitors use your maps today. We can help you add a Crime Riskmap layer that fits your experience.